Package lattice
Detailed Description
Title:Lattice Graphics Description:Implementation of Trellis Graphics. See ?Lattice for a brief introduction.
Author:Deepayan Sarkar <deepayan.sarkar@r-project.org> Maintainer:Deepayan Sarkar <deepayan.sarkar@r-project.org> Version:0.12-11 Built:R 2.2.0; i486-pc-linux-gnu; 2005-10-29 03:41:23; unix Date:2005/10/26 Depends:R (>= 2.2.0) LazyLoad:yes LazyData:yes License:GPL version 2 or later Packaged:Thu Oct 27 11:36:33 2005; hornik Priority:recommended Suggests:grid
barchart.table
table methods for barchart and dotplot
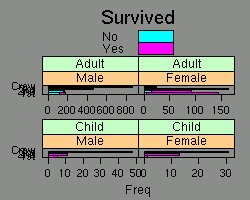
Last ouput from barchart.table(). For all plots see PDF file.
PDF output with all plots
Example code and log output is in the "Files" section, please see: lattice/barchart.table/example.log
barley
Yield data from a Minnesota barley trial
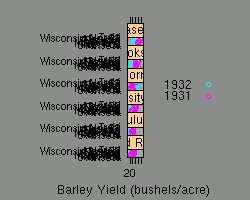
Last ouput from barley(). For all plots see PDF file.
PDF output with all plots
Example code and log output is in the "Files" section, please see: lattice/barley/example.log
cloud
3d Scatter Plot and Wireframe Surface Plot
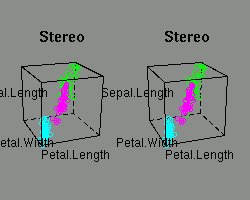
Last ouput from cloud(). For all plots see PDF file.
PDF output with all plots
Example code and log output is in the "Files" section, please see: lattice/cloud/example.log
equal.count
shingles
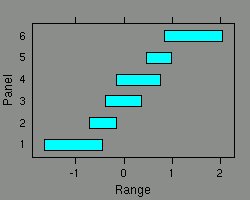
Last ouput from equal.count(). For all plots see PDF file.
PDF output with all plots
Example code and log output is in the "Files" section, please see: lattice/equal.count/example.log
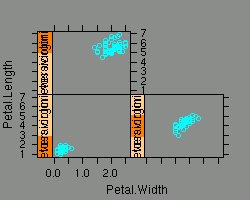
ethanol
Engine exhaust fumes from burning ethanol
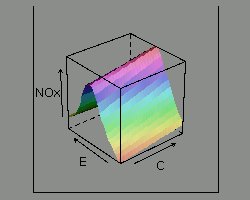
Last ouput from ethanol(). For all plots see PDF file.
PDF output with all plots
Example code and log output is in the "Files" section, please see: lattice/ethanol/example.log
histogram
Histograms and Kernel Density Plots
Last ouput from histogram(). For all plots see PDF file.
PDF output with all plots
Example code and log output is in the "Files" section, please see: lattice/histogram/example.log
levelplot
Level Plots
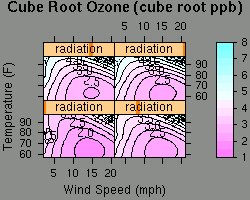
Last ouput from levelplot(). For all plots see PDF file.
PDF output with all plots
Example code and log output is in the "Files" section, please see: lattice/levelplot/example.log
make.groups
Grouped data from multiple vectors
Last ouput from make.groups(). For all plots see PDF file.
PDF output with all plots
Example code and log output is in the "Files" section, please see: lattice/make.groups/example.log
melanoma
Melanoma skin cancer incidence
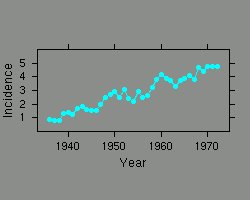
Last ouput from melanoma(). For all plots see PDF file.
PDF output with all plots
Example code and log output is in the "Files" section, please see: lattice/melanoma/example.log
panel.identify
Functions to Interact with Lattice Plots
Last ouput from panel.identify(). For all plots see PDF file.
PDF output with all plots
Example code and log output is in the "Files" section, please see: lattice/panel.identify/example.log
panel.violin
Panel Function to create Violin Plots
Last ouput from panel.violin(). For all plots see PDF file.
PDF output with all plots
Example code and log output is in the "Files" section, please see: lattice/panel.violin/example.log
print.trellis
Print Trellis Objects
Last ouput from print.trellis(). For all plots see PDF file.
PDF output with all plots
Example code and log output is in the "Files" section, please see: lattice/print.trellis/example.log
qq
Quantile-Quantile Plots of Two Samples
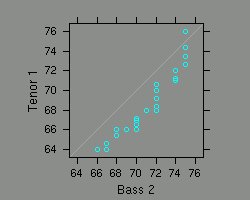
Last ouput from qq(). For all plots see PDF file.
PDF output with all plots
Example code and log output is in the "Files" section, please see: lattice/qq/example.log
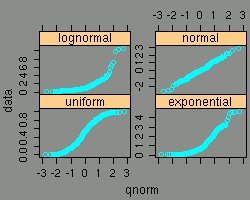
qqmath
Q-Q Plot with Theoretical Distribution
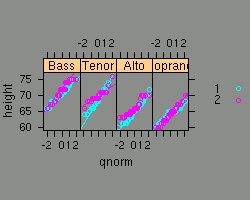
Last ouput from qqmath(). For all plots see PDF file.
PDF output with all plots
Example code and log output is in the "Files" section, please see: lattice/qqmath/example.log
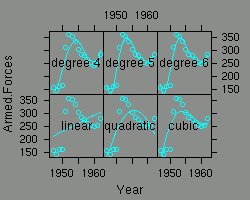
rfs
Residual and Fit Spread Plots
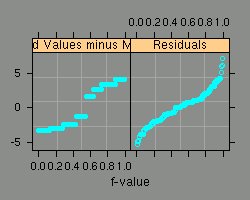
Last ouput from rfs(). For all plots see PDF file.
PDF output with all plots
Example code and log output is in the "Files" section, please see: lattice/rfs/example.log
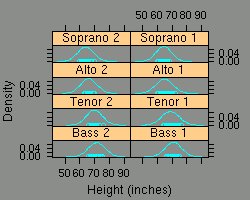
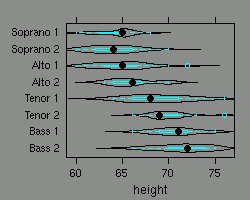
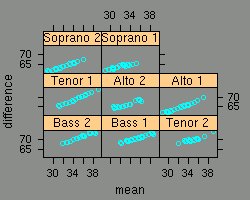
singer
Heights of New York Choral Society singers
Last ouput from singer(). For all plots see PDF file.
PDF output with all plots
Example code and log output is in the "Files" section, please see: lattice/singer/example.log
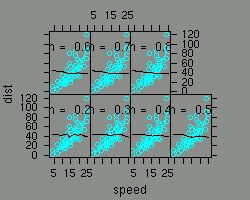
splom
Scatter Plot Matrices
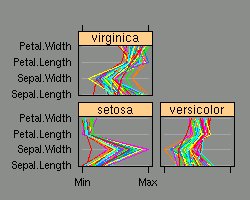
Last ouput from splom(). For all plots see PDF file.
PDF output with all plots
Example code and log output is in the "Files" section, please see: lattice/splom/example.log
strip.default
In-built Trellis Strip Function
Last ouput from strip.default(). For all plots see PDF file.
PDF output with all plots
Example code and log output is in the "Files" section, please see: lattice/strip.default/example.log
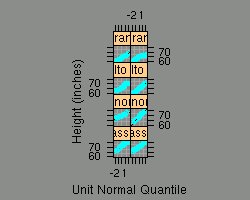
tmd
Tukey Mean-Difference Plot
Last ouput from tmd(). For all plots see PDF file.
PDF output with all plots
Example code and log output is in the "Files" section, please see: lattice/tmd/example.log
trellis.par.get
Graphical Parameters for Trellis Displays
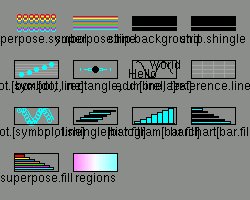
Last ouput from trellis.par.get(). For all plots see PDF file.
PDF output with all plots
Example code and log output is in the "Files" section, please see: lattice/trellis.par.get/example.log
update.trellis
Retrieve and Update Trellis Object
Last ouput from update.trellis(). For all plots see PDF file.
PDF output with all plots
Example code and log output is in the "Files" section, please see: lattice/update.trellis/example.log
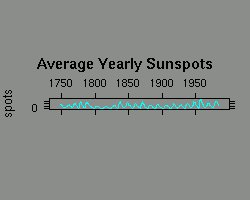
xyplot
Common Bivariate Trellis Plots
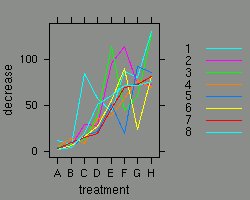
Last ouput from xyplot(). For all plots see PDF file.
PDF output with all plots
Example code and log output is in the "Files" section, please see: lattice/xyplot/example.log
Generated on Fri Apr 14 15:02:07 2006 for RGraphExampleLibrary by
 1.4.6
1.4.6